Website owner: James Miller
Measures of dispersion. Mean deviation. Semi-interquartile range. 10-90 percentile range. Standard deviation. Coefficient of variation. Standardized variable. Standard scores.
Percentile. A value on a scale of 100 that indicates the percent of a distribution that is equal to or below it. It is a way of expressing where an observation falls in a range of other observations. For example, if a score falls in the 20th percentile, this means that 20 percent of all the scores recorded are lower.
Measure of dispersion. The degree to which numerical data tend to spread about an average value is called the dispersion or variation of the data.
Various measures of dispersion or variation are available, the most common being the range, mean deviation, semi-interquartile range, 10-90 percentile range, and the standard deviation.
1. Range of a set of numbers. The difference between the largest and smallest numbers in the set.
Example. The range of the set 3, 3, 3, 4, 4, 5, 5, 5, 6, 7, 8, 8, 9, 9, 9 is 9 - 3 = 6. Sometimes the range is given by simply quoting the smallest and largest numbers. Thus the range in this example could be given as 3 to 9 or 3-9.
2. Mean deviation (or average deviation). The mean deviation (or average deviation) of a set of n numbers x1, x2, ... , xn is defined as

where
![]() is the arithmetic mean and
is the arithmetic mean and
![]() is the absolute value of the deviation of xi from
is the absolute value of the deviation of xi from
![]() .
.
If x1, x2, ... , xk occur with frequencies f1, f2, ... , fk respectively, then the mean deviation can be written as

This form is useful for grouped data where the x’s represent class marks and the fi’s are the corresponding class frequencies.
Occasionally the mean deviation is defined in terms of absolute deviations from the median or other average instead of the mean.
An interesting property of the sum

is that it is a minimum when a is the median.
Note that it would be more accurate to use the terminology mean absolute deviation instead of mean deviation.
3. Semi-interquartile range (or quartile deviation). The semi-interquartile range or quartile deviation of a set of data is defined as
Semi-interquartile range = Q = (Q3 - Q1) / 2
Where Q1 and Q3 are the first and third quartiles of the data.
4. 10-90 percentile range. The 10-90 percentile range is defined by
10-90 percentile range = P90 - P10
where P10 and P90 are the 10th and 90th percentiles of the data.
5. Standard deviation. The standard deviation of a set of n numbers x1, x2, ... xn is denoted by s and defined as

where
![]() is the arithmetic mean of the numbers.
is the arithmetic mean of the numbers.
The standard deviation is thus the square root of the mean of the squares of the deviations from the mean and is sometimes called the root mean square deviation.
If x1, x2, ... xk occur with frequencies f1, f2, ... , fk respectively, the standard deviation can be written as

where n = Σf. This form is useful for grouped data.
Note. Some authors define standard deviation with n - 1 replacing n in the denominators of 3)
and 4) because the resulting value represents a better estimate of the standard deviation. For
large values of n (n > 30) there is practically no difference. If a better estimate is needed we can
always obtain it by multiplying the standard deviation by
![]() .
.
Variance. The variance of a set of data is defined as s2, the square of the standard deviation.
Short methods for computing the standard deviation
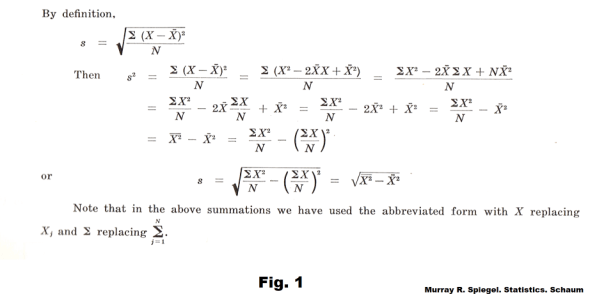
Theorem 1. The following two formulas represent short methods for computing standard deviations:


where
![]() denotes the mean of the squares of the various values of x and
denotes the mean of the squares of the various values of x and
![]() denotes the square
of the mean of the various values of x. For a proof that these formulas can be derived from the
definition of the standard deviation of equation 3) see Fig. 1.
denotes the square
of the mean of the various values of x. For a proof that these formulas can be derived from the
definition of the standard deviation of equation 3) see Fig. 1.
Theorem 2. If di = xi - A are the deviations of xi from some arbitrary constant A, the results 5) and 6) become respectively


Theorem 3. If each class mark X in a frequency distribution having class intervals of equal size c is coded into a corresponding value u according to the relation X = A + cu, where A is the given class mark, then the standard deviation can be written as


When data are grouped into a frequency distribution whose class intervals have equal size c, we have di = cui and xi = a + cui and 6) becomes 7).
This last formula provides a very short method for computing the standard deviation and should always be used for grouped data when the class interval sizes are equal. It is called the coding method.

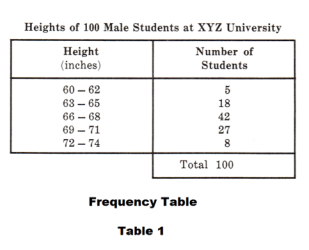
Table 1 shows a frequency table for the heights of 100 male students at XYZ University and Table 2 shows the computation of the standard deviation using the coding method where A is arbitrarily chosen as equal to the class mark 67 and c = 3, the class interval size.
Properties of the standard deviation
1. The standard deviation can be defined as
![]()
where a
is an
average
besides the arithmetic mean. Of all such standard deviations, the minimum is that for which a =
![]() .
.

2. For normal distributions:
(a) 68.27 % of the cases are included between
![]() - s and
- s and
![]() + s (i.e. one standard deviation on
either side of the mean)
+ s (i.e. one standard deviation on
either side of the mean)
(b)
95.45
%
of
the
cases
are
included
between
![]() - 2s and
- 2s and
![]() + 2s (i.e. two standard deviations on either side of the mean)
+ 2s (i.e. two standard deviations on either side of the mean)
(b) 99.73 % of the cases are included between
![]() - 3s and
- 3s and
![]() + 3s (i.e. three standard deviations
on either side of the mean)
+ 3s (i.e. three standard deviations
on either side of the mean)
See Fig. 2.
3. Suppose two sets consisting of n1 and n2 numbers (two frequency distributions with total
frequencies n1 and n2 ) have variances given by s12 and s22 respectively and the same mean
![]() .
Then the combined or pooled variance of both sets (or both frequency distributions) is given by
.
Then the combined or pooled variance of both sets (or both frequency distributions) is given by

Observe that this is a weighted arithmetic mean of the variances. This result can be generalized to 3 or more sets.
Empirical relationships between measures of dispersion
For moderately skewed distributions the following empirical formulas hold:
1. Mean deviation = 4/5 (Standard Deviation)
2. Semi-interquartile Range = ⅔ (Standard Deviation)
These formulas are consequences of the fact that for the normal distribution the mean deviation and semi-interquartile range are equal respectively to 0.7979 and 0.6745 times the standard deviation.
Absolute and relative dispersion. Coefficient of variation
The actual variation or dispersion as determined from the standard deviation or other measure of dispersion is called the absolute dispersion. However, a variation or dispersion of 10 inches in measuring a distance of 1000 feet is quite different in effect from a dispersion of 10 inches in measuring a distance of, say, 10 feet. To address this fact we have the relative dispersion defined as
![]()
where the Absolute dispersion could be standard deviation or some other measure of dispersion and Average could be, say, the mean, median, or mode.
Coefficient of Variation. The coefficient of variation is defined as
![]()
where s is the standard deviation and
![]() is the mean. The coefficient of variation is also called
the coefficient of dispersion and is generally expressed as a percentage.
is the mean. The coefficient of variation is also called
the coefficient of dispersion and is generally expressed as a percentage.
Standardized variable, Standard scores. The variable
![]()
which measures the deviation from the mean in units of the standard deviation is called a standardized variable and is a dimensionless quantity (i.e. it is independent of the units used).
If deviations from the mean are given in units of the standard deviation, they are said to be expressed in standard units or standard scores.
References
Murray R Spiegel. Statistics (Schaum Publishing Co.)
Jesus Christ and His Teachings
Way of enlightenment, wisdom, and understanding
America, a corrupt, depraved, shameless country
On integrity and the lack of it
The test of a person's Christianity is what he is
Ninety five percent of the problems that most people have come from personal foolishness
Liberalism, socialism and the modern welfare state
The desire to harm, a motivation for conduct
On Self-sufficient Country Living, Homesteading
Topically Arranged Proverbs, Precepts, Quotations. Common Sayings. Poor Richard's Almanac.
Theory on the Formation of Character
People are like radio tuners --- they pick out and listen to one wavelength and ignore the rest
Cause of Character Traits --- According to Aristotle
We are what we eat --- living under the discipline of a diet
Avoiding problems and trouble in life
Role of habit in formation of character
Personal attributes of the true Christian
What determines a person's character?
Love of God and love of virtue are closely united
Intellectual disparities among people and the power in good habits
Tools of Satan. Tactics and Tricks used by the Devil.
The Natural Way -- The Unnatural Way
Wisdom, Reason and Virtue are closely related
Knowledge is one thing, wisdom is another
My views on Christianity in America
The most important thing in life is understanding
We are all examples --- for good or for bad
Television --- spiritual poison
The Prime Mover that decides "What We Are"
Where do our outlooks, attitudes and values come from?
Sin is serious business. The punishment for it is real. Hell is real.
Self-imposed discipline and regimentation
Achieving happiness in life --- a matter of the right strategies
Self-control, self-restraint, self-discipline basic to so much in life